Shareholder Yield Calculator
How to Use This Calculator
Enter the annual amounts for dividends, net stock repurchases, and net debt reduction. Then enter the market capitalization at the start of the period. The calculator will show you the total shareholder yield.
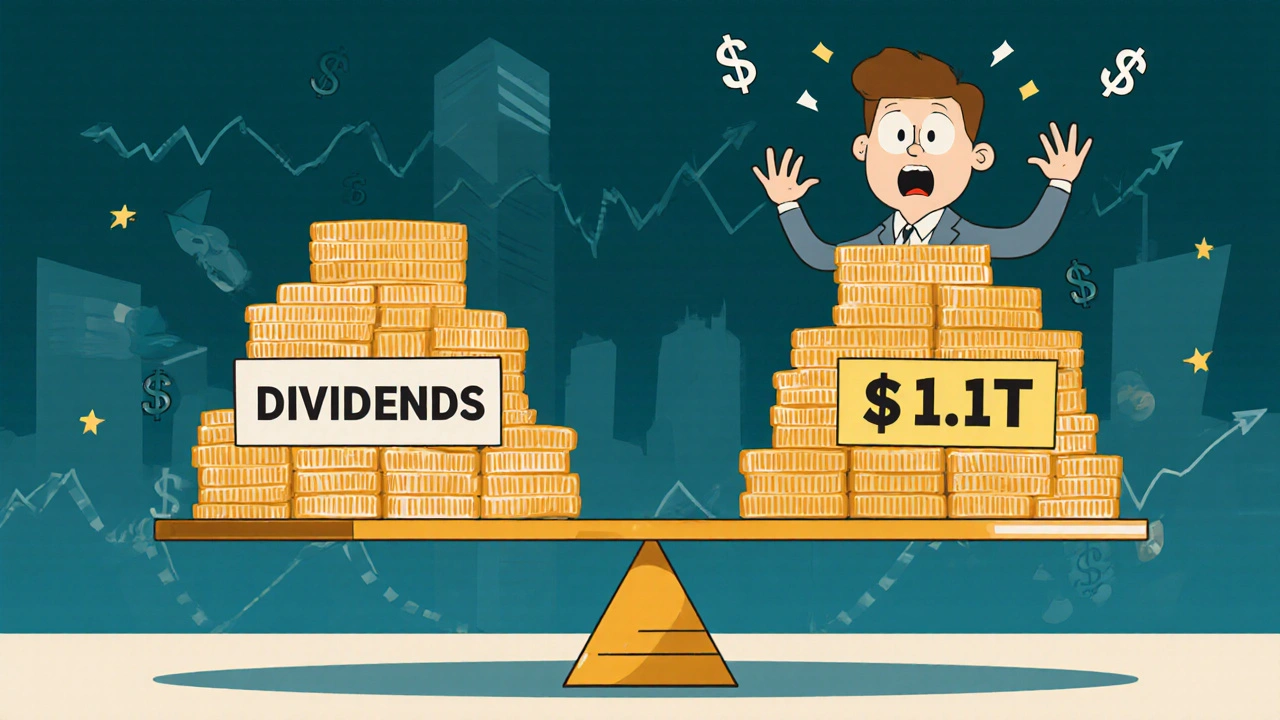
Most investors still think dividends are the only way companies return money to shareholders. That’s outdated. In 2022, U.S. companies returned $1.8 trillion to shareholders. Of that, $1.1 trillion came from buybacks. Only $700 billion came from dividends. If you’re only looking at dividends, you’re ignoring more than half the picture.
What Is Shareholder Yield?
Shareholder yield is the total cash a company gives back to shareholders through three channels: dividends, net stock buybacks, and net debt reduction. It’s not just about what’s paid out-it’s about what’s actually returned to your pocket, directly or indirectly.
The formula is simple:
Shareholder Yield = (Dividends + Net Stock Repurchases + Net Debt Reduction) / Market Capitalization
Let’s break it down:
- Dividends: Cash paid directly to shareholders over the last 12 months.
- Net Stock Repurchases: Money spent buying back shares minus money spent issuing new ones. If a company issues stock to employees, that reduces the net buyback. You can’t ignore that.
- Net Debt Reduction: How much debt the company paid off minus how much new debt it took on. This isn’t cash in your hand, but it increases the value of each remaining share.
- Market Capitalization: Use the value at the start of the period, not today’s price. This keeps the calculation consistent.
Example: A company pays $300 million in dividends, buys back $200 million in stock (net of new issuances), and pays down $100 million in debt. Its market cap at the start of the year was $10 billion. Shareholder yield = $600 million / $10 billion = 6%.
Why Buybacks Matter More Than You Think
Dividends are straightforward. Buybacks? They’re trickier-but often more powerful.
When a company buys back shares, it reduces the number of shares outstanding. That means each remaining share owns a bigger slice of the company’s profits. If earnings stay flat, earnings per share (EPS) go up. That can push the stock price higher, even without any change in the business.
But here’s the catch: Buybacks only create value if the stock is undervalued. If a company buys back shares at $150 when they’re worth $100, it’s destroying value. S&P Global found that companies buying back shares near their 52-week highs underperformed those buying at lows by 3.8 percentage points per year.
That’s why you need to look at buyback yield-the buyback portion alone-alongside valuation. Apple spent $90 billion on buybacks in 2023. At its market cap, that’s a 3.8% buyback yield. But if Apple’s stock was trading at 20x earnings, that’s still reasonable. If it were trading at 40x? That’s a red flag.
Dividends vs. Shareholder Yield: The Numbers Don’t Lie
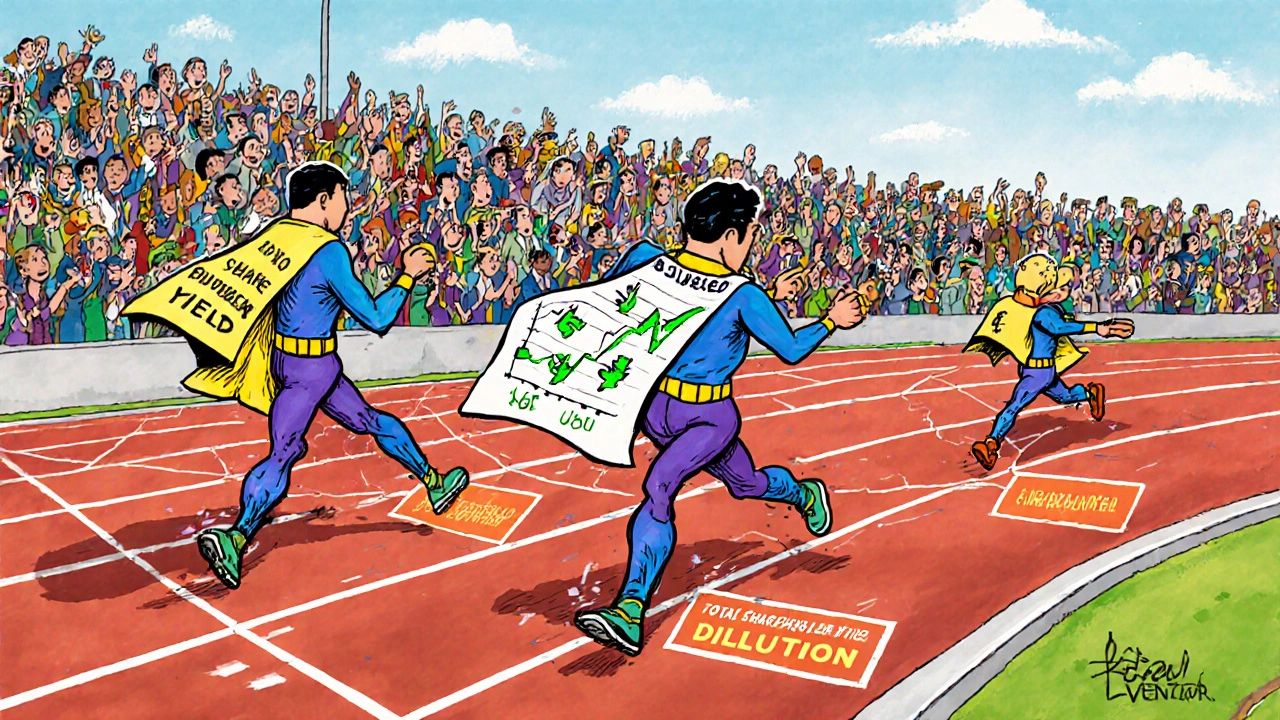
MSCI tracked three portfolios from 2010 to 2020:
- High Dividend Yield Index: 7.9% annual return
- Buyback Yield Index: 10.3% annual return
- Total Shareholder Yield Index: 9.7% annual return
Buybacks beat dividends. And combining both beat dividends alone by 1.8 percentage points per year.
Over a 15-year stretch (2007-2022), the top 20% of stocks by shareholder yield outperformed the top 20% by dividend yield alone by 2.3 percentage points annually. That’s not a small edge-it’s the difference between mediocre returns and real wealth building.
And sector differences are telling. Consumer Staples and Utilities pay high dividends-2.8% and 2.5% respectively. But Communication Services and Financials? They pay lower dividends (1.2% and 2.1%) but have shareholder yields of 4.1% and 3.9%. Why? Because they’re buying back massive amounts of stock.
If you’re only chasing dividends, you’re missing out on the biggest return engines in the market.
The Hidden Trap: Stock-Based Compensation
Not all buybacks are created equal. A lot of them are just offsetting dilution from employee stock options and RSUs.
S&P Global found that from 2015 to 2020, 40% of S&P 500 buybacks were used to replace shares given to employees. That means the company didn’t reduce the share count at all-it just kept it flat. No real value created.
This is why you must look at net buybacks. If a company spent $1 billion on buybacks but issued $600 million in new stock to employees, the net buyback is only $400 million. The real shareholder yield is based on that $400 million, not the gross number.
The CFA Institute and MSCI now recommend adjusting for this. MSCI’s 2023 update added a compensation adjustment to its shareholder yield index. If you’re using free financial data sites, they often don’t do this. You’ll think a company has a 5% yield when it’s really 2%.
Debt Reduction: The Silent Contributor
Debt reduction isn’t cash in your pocket. But it matters.
When a company pays down debt, it lowers its risk profile. That can lead to a lower cost of capital, higher credit ratings, and more flexibility to invest or buy back shares later. It also means more cash flow goes to shareholders instead of creditors.
But it’s not as direct as dividends or buybacks. A company that cuts debt by $500 million but has a $20 billion market cap adds only 2.5% to shareholder yield. That’s meaningful, but not enough to be the main driver. The best companies combine strong buybacks with steady debt paydown.
How to Use Shareholder Yield in Your Investing
You don’t need a PhD in finance to use this. Here’s how to start:
- Find companies with a shareholder yield above 4%. Boston Partners recommends this as a minimum threshold. Anything below 3% is usually not worth the attention.
- Check the buyback portion. It should be at least 1.5% of market cap. If it’s less, the company might be relying too much on dividends or debt paydown.
- Look at valuation. Don’t buy a company with a 6% yield if it’s trading at 30x earnings. Look for yields above 4% with P/E under 18.
- Verify net buybacks. Check the 10-K or 10-Q. Look for “repurchases of common stock” and “proceeds from issuance of common stock.” Subtract the second from the first.
- Avoid companies with heavy dilution. If stock-based compensation is eating up more than half the buyback, walk away.
Example: In 2023, Microsoft had a shareholder yield of 5.1%. Dividends: 0.9%. Buybacks: 3.8%. Debt reduction: 0.4%. P/E: 30. That’s high valuation, so even though the yield is strong, it’s risky. Meanwhile, Broadcom had a 6.2% yield with a P/E of 22. Buybacks were 4.5%. That’s a better combo.
ETFs and Tools to Help You
You don’t have to build this from scratch. There are ETFs that track shareholder yield:
- Cambria Shareholder Yield ETF (SYLD): $18 billion in assets. Focuses on high-yield, low-debt companies.
- SPDR S&P U.S. Shareholder Yield ETF (SYLD): Tracks the same index.
- Invesco S&P 500 Buyback ETF (PKW): Focuses only on buybacks.
These ETFs handle the math for you. SYLD has returned 11.2% annually since 2019, outperforming the S&P 500 by over 2% per year.
For DIY investors, Bloomberg Terminal and FactSet give you full shareholder yield data. Free tools like Yahoo Finance and Finviz only show dividends. You’ll need to dig into financial statements for buyback numbers.
Why This Matters Now
Since the 2017 tax cuts, buybacks have exploded. Companies had more cash and fewer tax incentives to hold it. In 2018, buybacks jumped $1.08 trillion year-over-year.
Now, regulators are catching up. The SEC requires quarterly buyback disclosures (Form 8-K). That means you can track exactly when companies are buying-and whether they’re buying high or low.
Vanguard predicts shareholder yield will replace dividend yield as the standard metric within five years. Why? Because it’s the only way to measure real capital return.
Dividends are a legacy metric. Buybacks are the new normal. And together, they form the only complete picture of how companies treat their owners.
The Bottom Line
Stop chasing dividends alone. If you’re not looking at buybacks and debt paydown, you’re flying blind.
Shareholder yield isn’t just a fancy term-it’s the most accurate way to measure how much value a company is giving back to you. The companies returning 4% or more of their market cap each year, with clean buybacks and reasonable valuations, are the ones that outperform over time.
Look for yield. Look for net buybacks. Look for valuation. Ignore the noise. The market rewards those who see the full picture.
Is shareholder yield better than dividend yield?
Yes, for most investors. Dividend yield only captures about 35% of total capital returns in today’s market. Shareholder yield includes dividends, net buybacks, and debt reduction-covering 95% of how companies return cash. Over the past 15 years, stocks ranked by shareholder yield have consistently outperformed those ranked by dividend yield alone.
Are buybacks always good for shareholders?
No. Buybacks only help if the stock is undervalued. If a company buys back shares at peak prices, it wastes cash. S&P Global found companies that bought back shares near their 52-week highs underperformed those buying at lows by 3.8% per year. Always check valuation before assuming buybacks are good.
How do I calculate net buybacks?
Take the total amount spent on repurchasing shares and subtract the amount raised from issuing new shares. You’ll find both numbers in the cash flow statement under "Financing Activities." If a company spent $500 million on buybacks but issued $200 million in new stock, net buybacks = $300 million.
Does shareholder yield include stock options?
No-only net buybacks do. Stock options and RSUs create new shares, which dilute ownership. That’s why you must subtract the value of new issuances from buybacks. Many free financial sites don’t adjust for this, so you’ll need to check the 10-K or 10-Q for accurate numbers.
What’s a good shareholder yield to aim for?
Aim for at least 4%. Companies with yields above 4% and P/E ratios under 18 have historically delivered 8.5-9.5% annual returns over the long term-outperforming the broader market. Avoid companies with yields below 3%, unless they’re in a high-growth phase with clear future return plans.

Comments (3)
Kenny McMiller
Shareholder yield is the real alpha generator, man. Dividends are just the ceremonial toast at the end of the banquet-buybacks are the whole damn feast. When a company buys back shares at a discount to intrinsic value, it’s essentially printing equity for existing holders. It’s wealth redistribution via balance sheet alchemy. And let’s not forget debt reduction-it’s the silent assassin of leverage, quietly lowering WACC and freeing up FCF for future distributions. The fact that retail investors still cling to dividend yield like a security blanket is both tragic and hilarious. You’re not investing in cash flows-you’re investing in ownership stakes. And ownership stakes grow when capital is allocated efficiently, not just when checks get mailed.
Dave McPherson
Ugh. Another finance bro mistaking accounting for investing. Buybacks are just corporate masturbation-companies inflate EPS to hit bonus targets while their CEOs cash out at the top of the cycle. S&P 500 firms spent $1.1T on buybacks in 2022? Cool. Now tell me how many of them are still solvent in 2030 after the next recession. And don’t even get me started on ‘net buybacks’-that’s just corporate PR with a spreadsheet. If you’re using SYLD ETF as your bible, you’re already late to the party. The real money’s in private equity, where they actually *own* the company instead of pretending to own a ticker. Also, Apple at 3.8% buyback yield? Bro, that’s just them offsetting dilution from 100k engineers getting RSUs. You think you’re getting alpha? You’re just the last guy holding the bag when the Fed cuts rates again.
RAHUL KUSHWAHA
Very interesting points 😊 I always thought dividends were the only way. Now I understand why some companies don’t pay dividends but still feel valuable. Will check my holdings for net buybacks now. Thank you for explaining with examples!